The first satRday in Berlin took place on 15 June 2019, where around 20 speakers and workshop moderators shared their experience using R in various fields and different types of applications. It was a pleasure to get to know members of the R community, and I would like to thank the organizers for this amazing day!
I had the chance to host a talk where I presented the methodology of the research I conducted for my master thesis, which consisted of a discourse network analysis of the most recent EU Copyright Directive debate (approved by the EU Parliament on 26 March 2019) using a combination of the Discourse Network Analyzer (DNA) software and R. This blog post builds on this presentation and provides further information about the method.

Discourse network analysis is a methodology developed by Philip Leifield (2009) to measure and visualise policy debates. It combines social network analysis with computer-assisted, qualitative content analysis. This method allows researchers to study the development of actors and ideas in a relational and systematic way, and can be used to discern with greater clarity the ways in which coalitions form around specific policy preferences or concerns and how these elements change over time.
This method can generally be broken down into four different steps:

Using open letters and official statements from different types of organisations, I extracted more than 425 statements either in favour or against specific aspects of the Copyright Directive. Each coded statement included four variables: the person, the organisation, the concept, and an agreement variable (0 or 1) reflecting if person/organisation X agreed or disagreed with concept y. Here a ‘concept’ refers to an abstract representation of the content that is being discussed, which in my analysis consisted of justifications and narratives. Below is an example of the coding process using a sentence from a letter sent to the EU by the Electronic Frontier Foundation (EFF):

As you can see, two statements were extracted from this sentence, both having a different agreement variable value since the person did not agree that ‘Article 11 and 13 should be included in the final proposal’ but did so with the second concept.
Once every text source is annotated and statements duly coded, it is possible to get a better picture about the (discursive) connections between the persons/organisations involved in the debate by analysing the underlying data in R. Importing the data from the DNA into R is done using the package rDNA, and using R instead of other network analysis software brings an advantage: both software can ‘communicate’ and any modification in your DNA database can easily be reflected in your data without needing to re-export/re-import csv files.
The most basic form of exported data is a square actor-by-actor matrix (adjacency matrix in network jargon) which shows how actors are related to each other, with their connections defined by their agreement or disagreement vis-à-vis different concepts. Different types of networks can be derived from this data, and various packages are available to visualise those networks. I decided to rely on igraph since this package is not only very flexible in terms of visualisation but also provides network analysis functions. After spending some time learning its syntax and tweaking the different parameters of its plot function, I was quite satisfied with the networks I was able to visualise.
The first network I plotted is a concept congruence network, a content-level network which provides an overall picture of the different arguments and narratives used in the debate and identifies the issues that are of most concern to the actors involved in the network. Since plotting every different statement would have resulted in an over-crowded network, the statements were grouped into 16 differents ‘frames’ capturing their substance at a more abstract level. Those frames were subsequently clustered into six different thematic areas such as civil rights, economic development, legal principles, etc. for visualisation purposes (signalled by the color scheme).
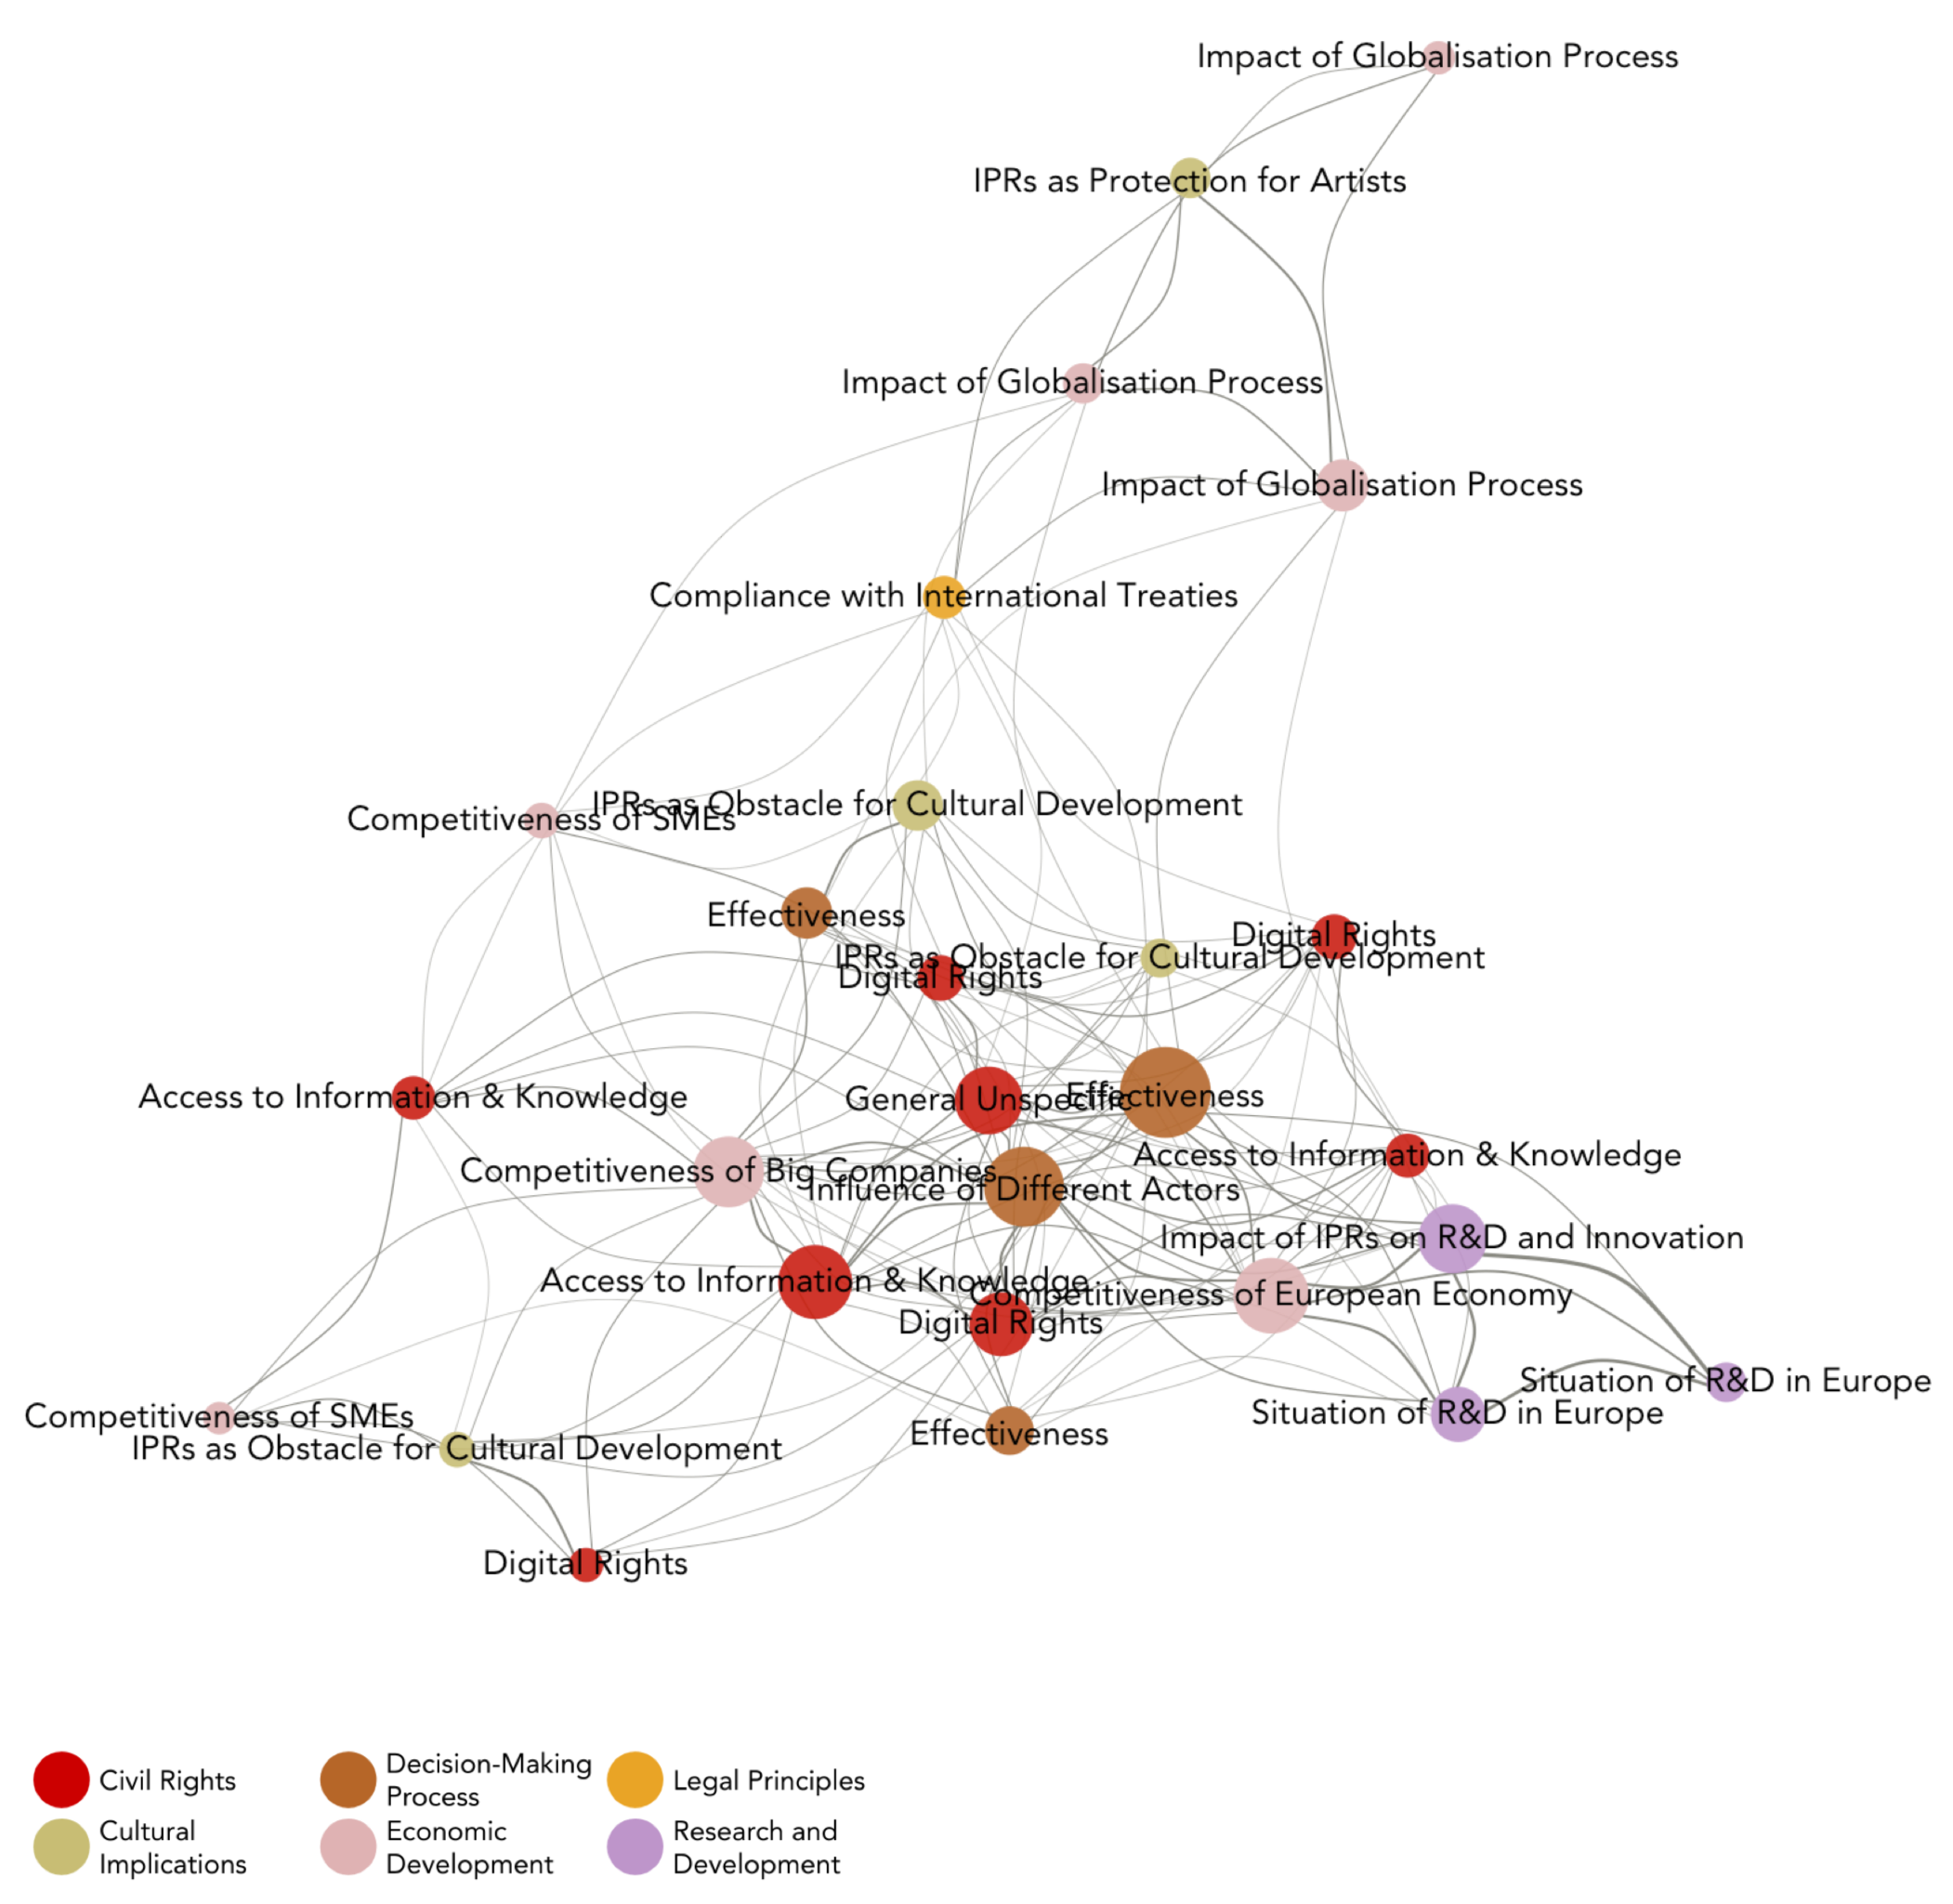
In such network, the edges (connections) between the nodes (in this case, the frames) are derived from a calculation of the agreement or disagreement of actors vis-à-vis those frames. Here it gets a bit technical: a connection between two nodes is only recorded if both nodes have the same qualifier value (either agreement or disagreement). In other words, a concept congruence network does not visually represent the actors, they are ‘underneath’ the network and their influence is converted into the relative edge weight (visualised as its width) connecting the frames.
This network is particularly helpful to explore how frames are related to each other, but cannot inform about which actors are sharing (or not sharing) a position on a particular issue. This can be done by plotting an affiliation network, which not only captures but also illustrates the connections between actors and frames. It is therefore a two-mode network, where edges originate from actors (represented by circles) and terminate in frames (represented by squares).
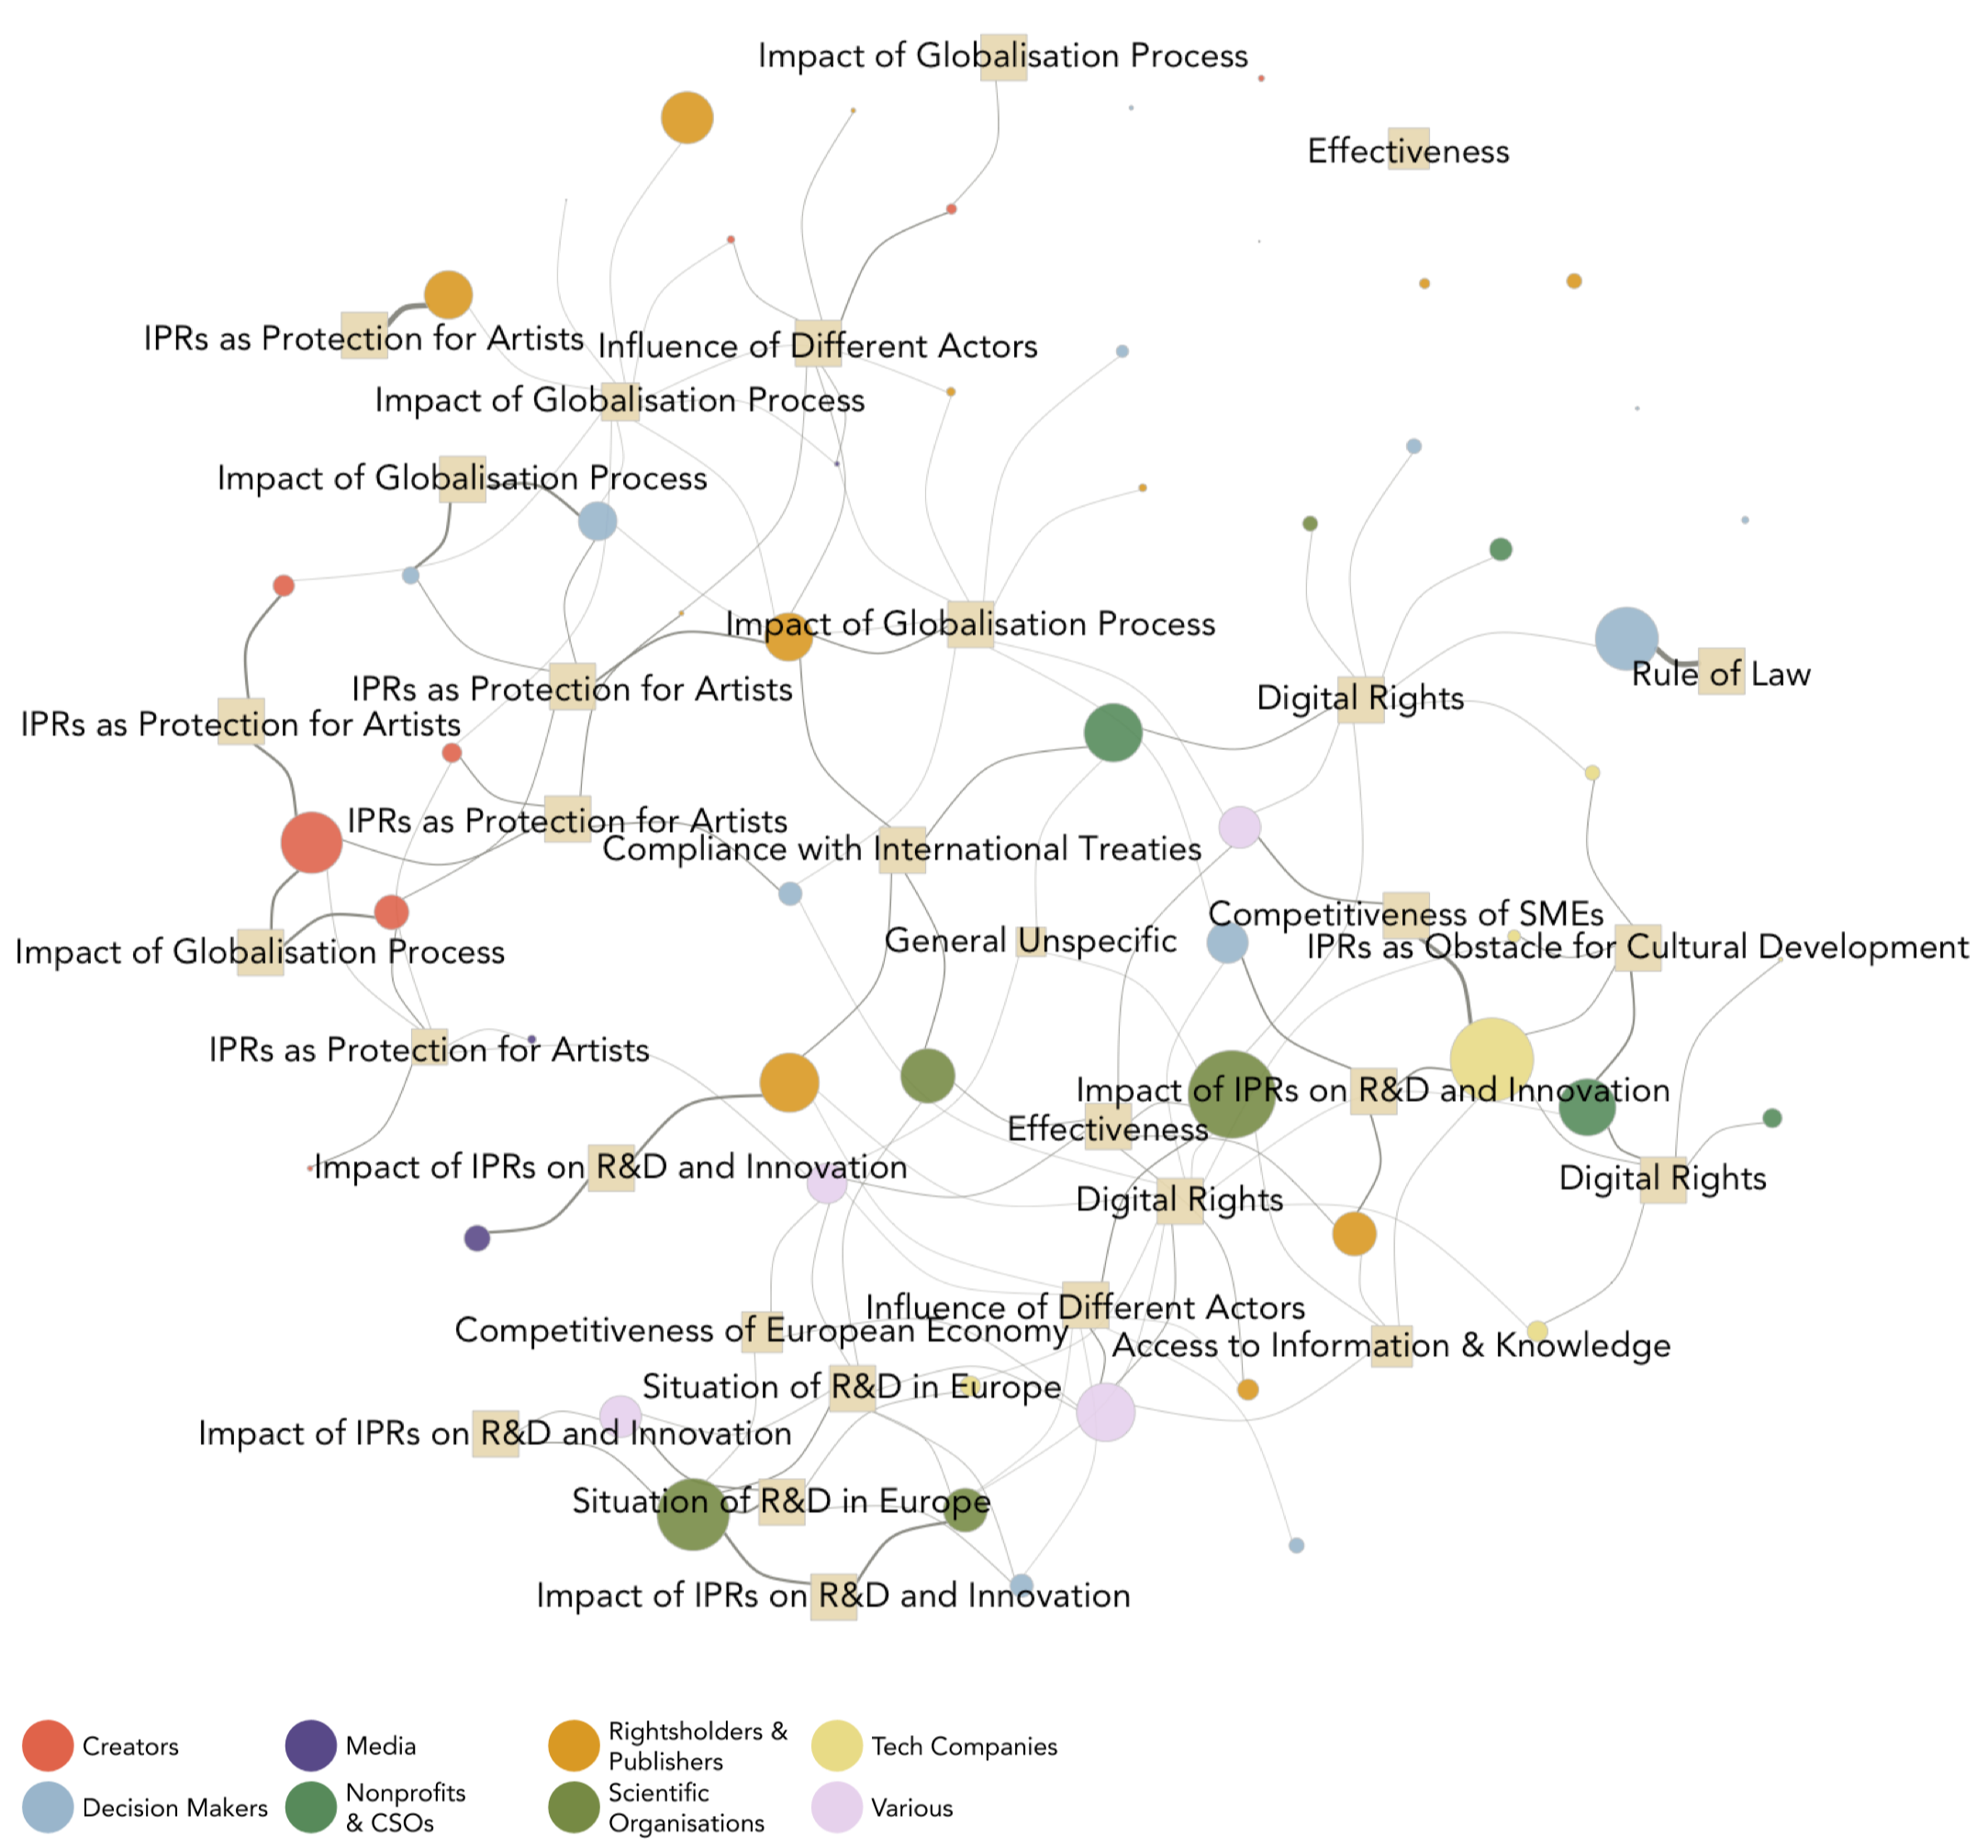
Since this network is the most “complete” network that can be derived from my data, it contains a lot of information and several transformations were needed to make it more readable and digestible (which will be described in a subsequent post). The resulting network shows that similar types of organisations are grouped around certain issues (e.g. there is to be a great deal of cohesion between the positions adopted by scientific organisations, nonprofits & CSOs, and tech companies.) and that there seems to be clusters/coalitions emerging from the network. Clearly indentifying and finding the boundaries of such coalitions is however rendered more complicated by the very dense nature of such networks.
Good news, there is another type of network which offers other possibilities. Plotting an actor congruence network focuses the analysis on the level of the actors by providing the clearest account of the connections that can be assumed to exist between members of a network. The strength of this type of representation is to comprehensibly map the actors of a debate and get clearer visual insights about the different clusters/coalitions in the network. A quick glance at the network indicates that the debate was indeed polarised, with only one organisation acting as a ‘broker’ between the two main clusters:

Looking at the underlying data of this network provides a wealth of information about the characteristics of the debate surrounding the EU Copyright Directive. We can see that organisations representing creators are mostly united in their discourse, while NGOs, tech companies and scientific organisations form an opposing group. This type of network is very fertile in terms of subsequent analyses: community detection algorithmns can empirically identify the coalitions within the network, which are (networkly-speaking) subgraphs that can then be further analysed according to their network properties. Moreover, looking at the composition of those subgraphs over time can provide insights about how those coalitions evolved during the debate, information that can subsequently be contrasted with the policy process and its outcome and provide additional insights, and so on…Going into further details about the results of this network analysis goes beyond the scope of this post, and I would invite you to read the thesis or look at its summary poster if you feel like learning more about its conclusions.
However, since this blog is about data and R, the nitty gritty of network analysis as well as the code I’ve written will be presented in a subsequent post.
Thank you for reading!
P.S. Slides of this presentation are available here.
